Completed samples

Completed sample projects with screenshots and working demo links.

This page is reserved for completed LynxCom sample work only. Each project shown here has a brief project introduction, a real screenshot and either a live demo or private walkthrough option.

Completed sample projects

Only completed, clickable sample work is shown here.

This page highlights completed sample projects with real screenshots and working demo/private walkthrough links. Planning ideas and package examples have been removed from this page.

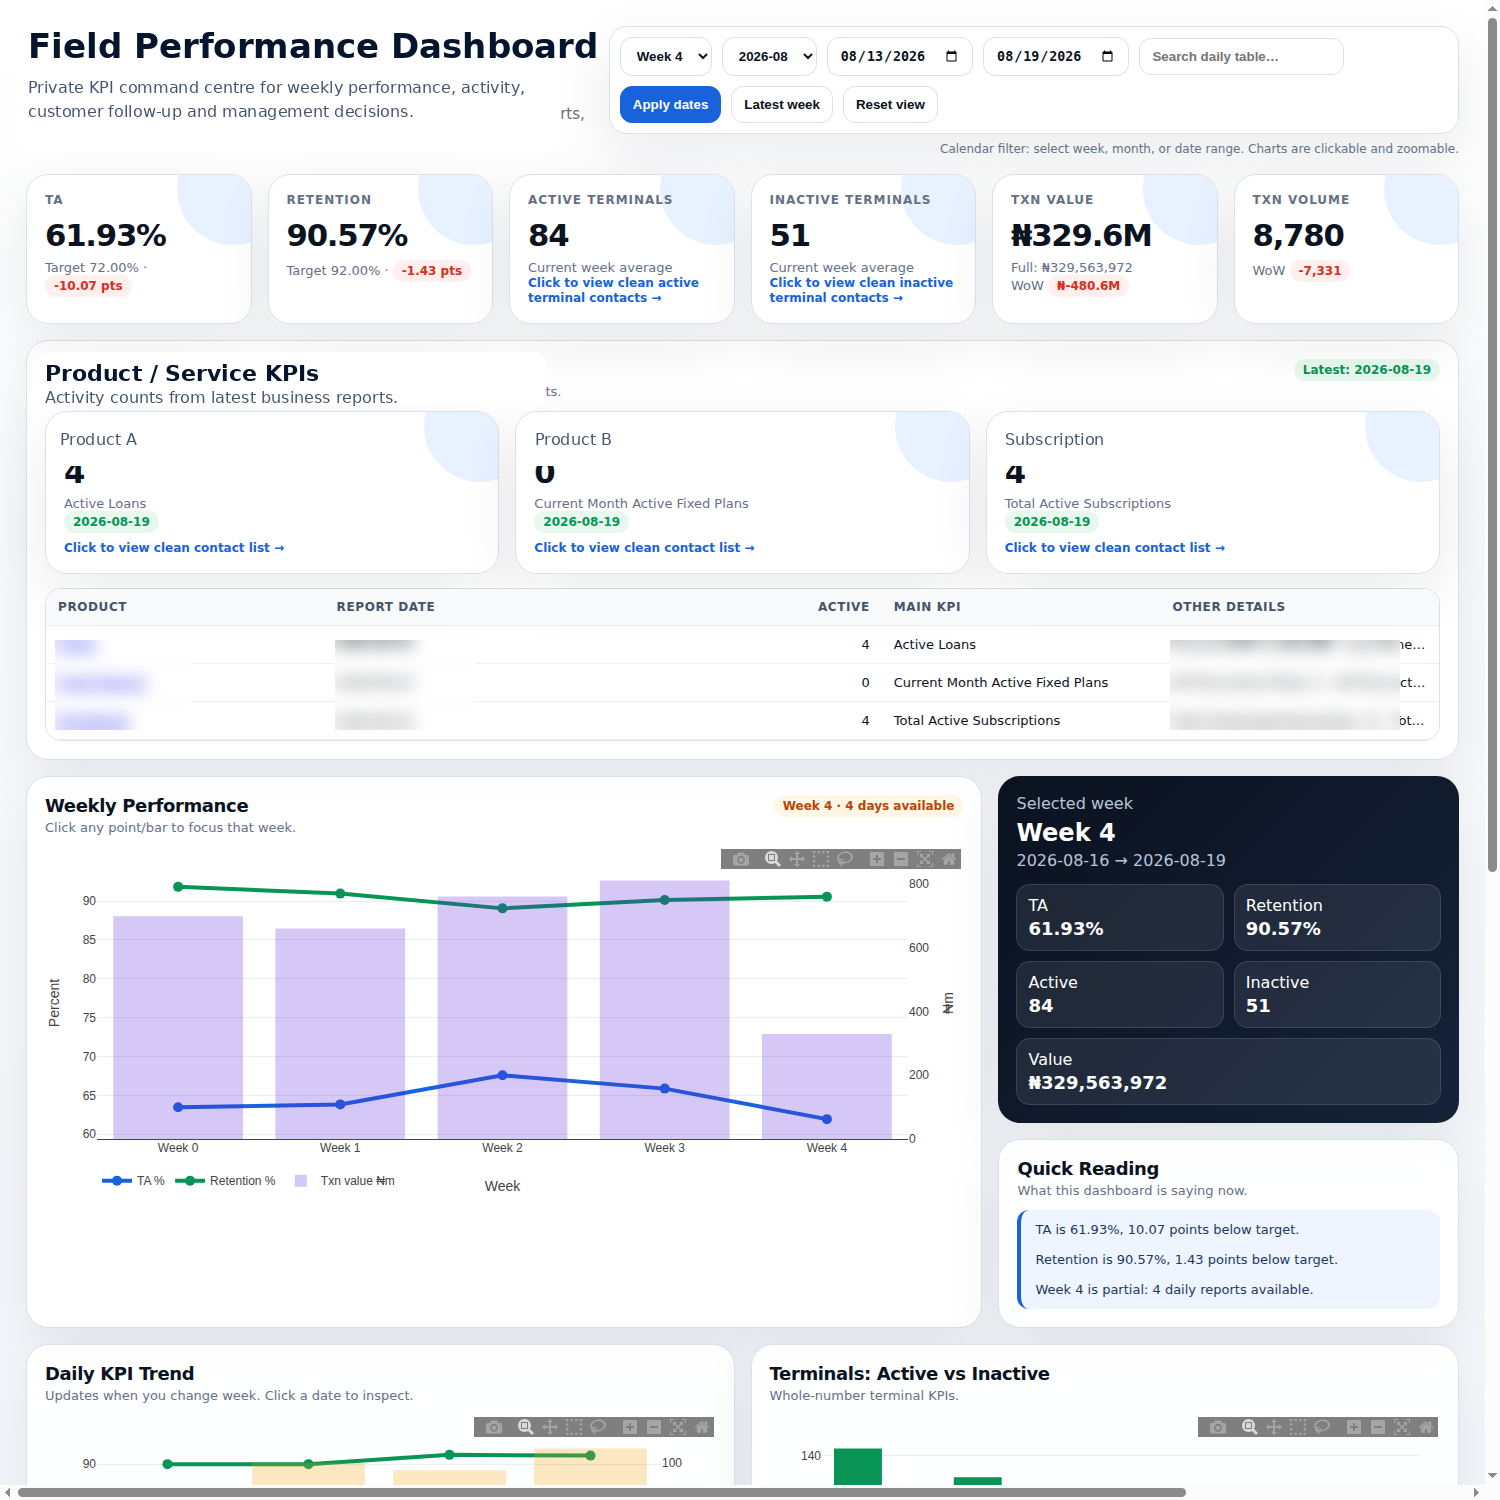
Anonymized screenshot of a field performance KPI dashboard
Completed Sample • Field Performance Dashboard

Business Relationship Performance Dashboard

An anonymized KPI command centre built for a field operations team to track weekly target achievement, retention, active/inactive accounts, transaction value, transaction volume and product/service performance.

Background

This dashboard was created from recurring field performance reports that were previously difficult to interpret quickly. The records were cleaned, grouped by week/date, converted into KPI-ready data and presented as a private web dashboard with scorecards, filters, charts, drilldowns and a quick-reading summary.

Problem it solves

Many teams receive reports but still struggle to know what action to take. This dashboard helps management immediately see where targets are being missed, which accounts are active or inactive, what changed during the week, and where follow-up should happen first.

Automation benefit

Instead of manually opening reports, calculating KPI gaps and searching for follow-up targets every week, the dashboard automates the reporting workflow: report data is prepared into dashboard-ready records, KPIs update from the latest figures, charts reveal movement, and managers can click straight into the accounts or areas that need action.

  • Reduces manual weekly reporting and spreadsheet interpretation
  • Turns raw reports into clear KPI cards with target gaps
  • Shows active/inactive account movement for follow-up planning
  • Connects chart clicks to underlying records instead of static visuals
  • Gives managers a quick reading of what needs attention now
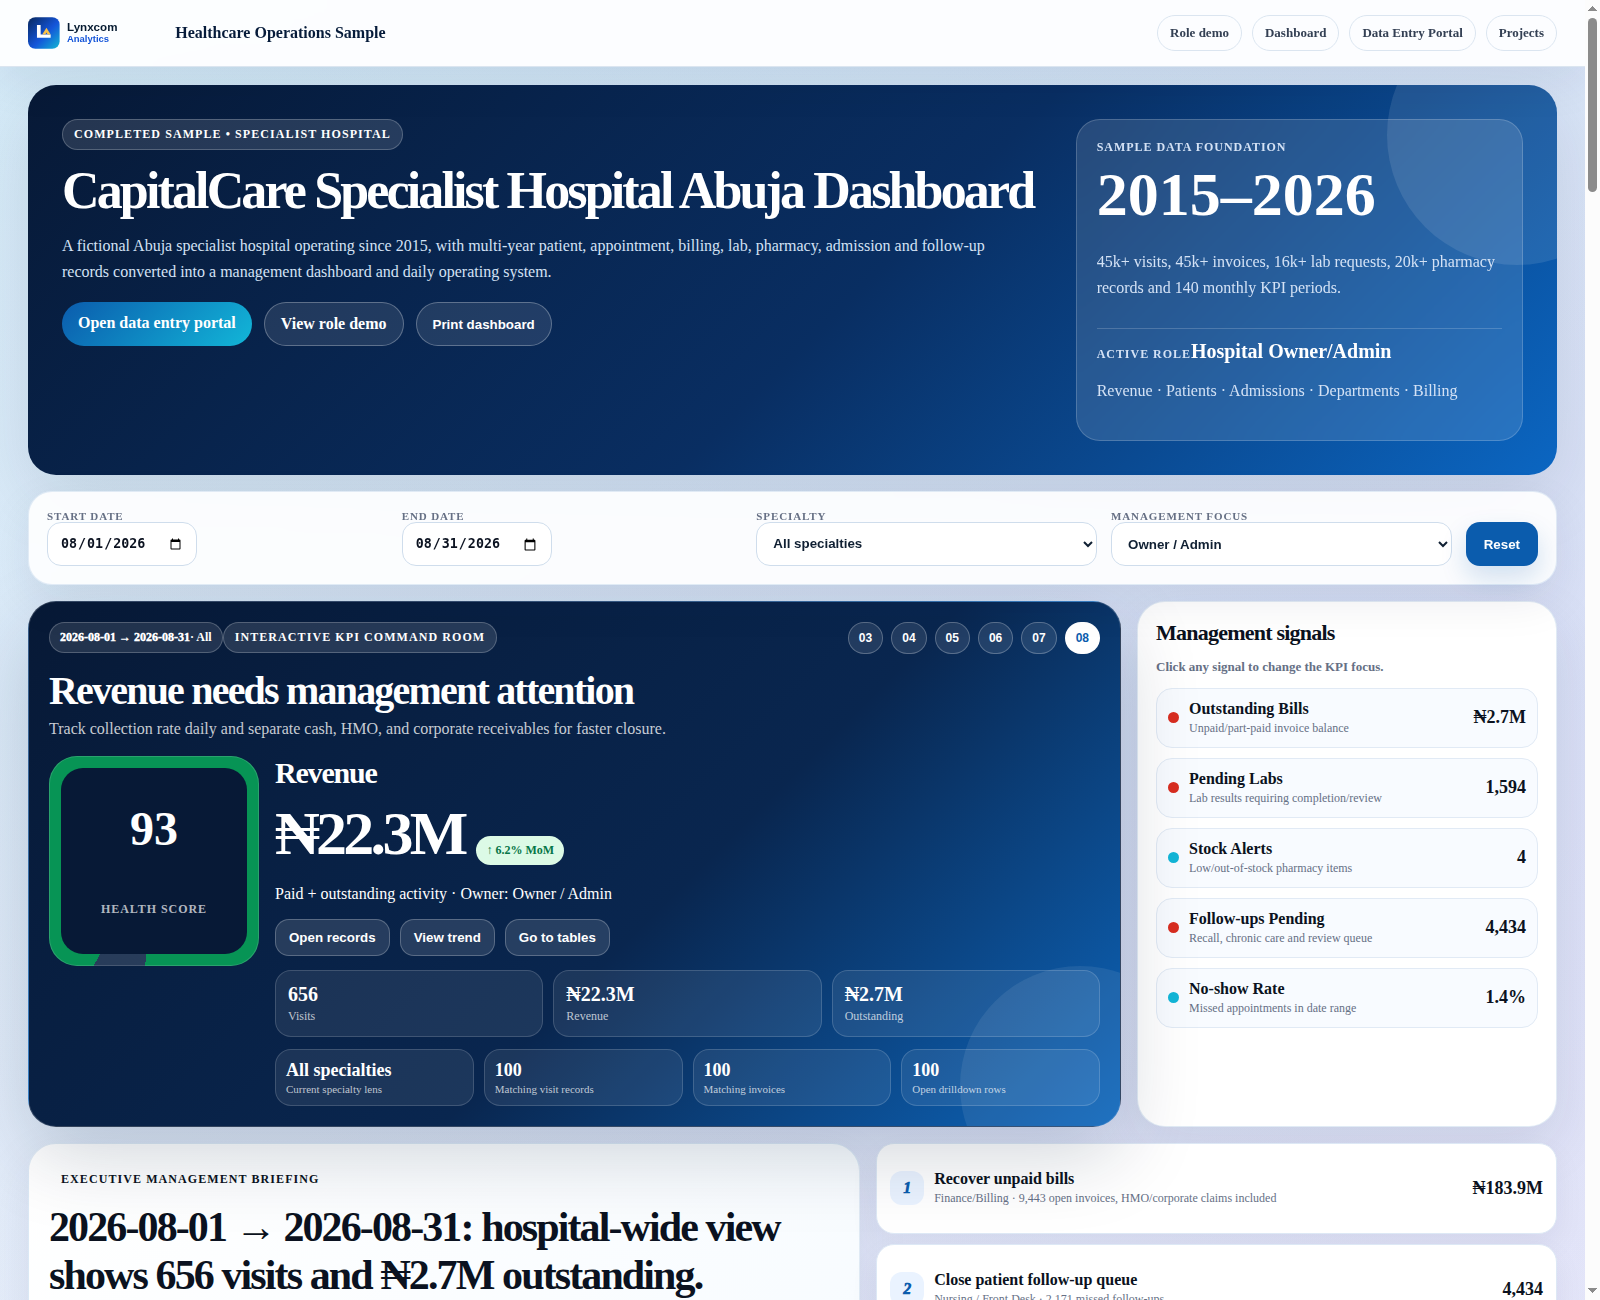
Screenshot of a specialist hospital operations dashboard sample
Completed Sample • Healthcare Operations Dashboard

Clinic & Specialist Hospital Operations Dashboard

A fictional Abuja specialist hospital sample showing how private clinics can connect patient registration, appointments, consultations, billing, lab, pharmacy, admissions and follow-up records into one management dashboard.

Background

The sample hospital has operated since 2015 and has thousands of patient, finance and clinical activity records. LynxCom converted the raw operational data into a dashboard-ready structure with monthly KPIs, department performance, billing queues, follow-up lists and pharmacy/lab alerts.

Problem it solves

Many hospitals have records spread across front desk books, Excel sheets, billing files, pharmacy notes and lab registers. This dashboard helps owners and administrators see patient flow, revenue, outstanding bills, no-show rates, stock issues, lab delays and follow-up gaps without manually joining reports.

  • Owner dashboard for visits, revenue, collections, outstanding bills and admissions
  • Operational queues for pending labs, patient follow-ups and pharmacy stock alerts
  • Specialty and doctor workload performance views
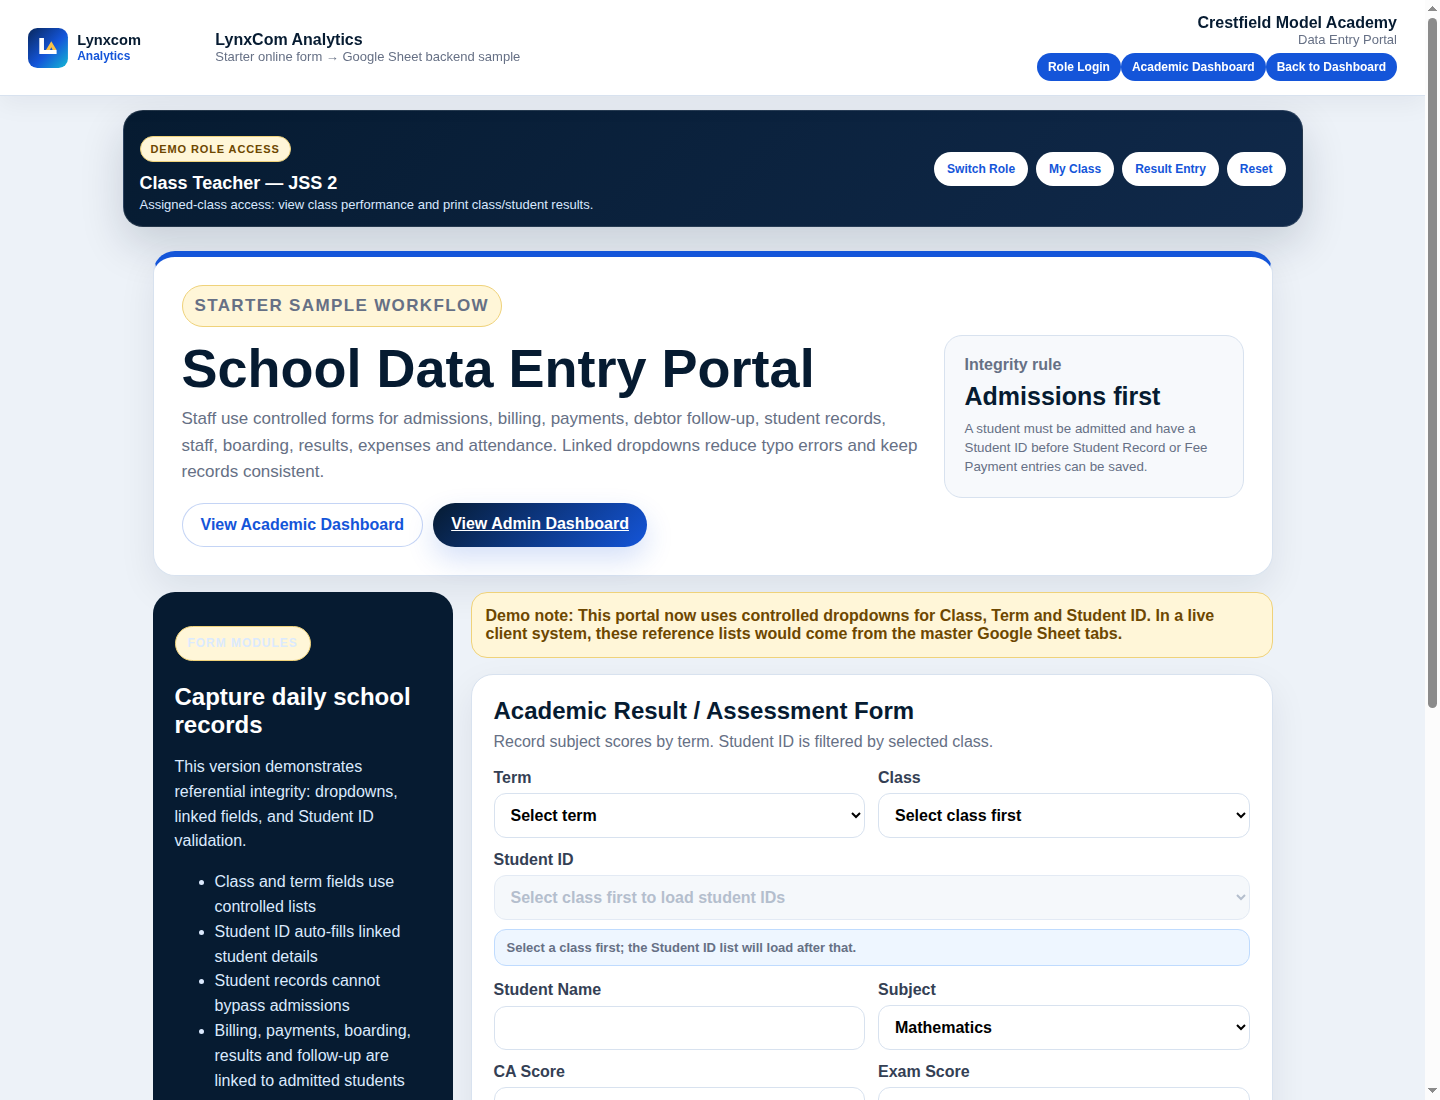
  • Central data entry portal for cleaner patient and service records

Want a system like one of these?

Tell us what your business currently tracks and what you want to improve. We will recommend whether you need a record foundation, online data portal, custom web dashboard, workflow automation or a full operating system.

Book a consultation